


Introduction: In the fast-paced world of data analytics, having a tool that provides a comprehensive view of your data is invaluable. Dashboards serve as the go-to solution for professionals seeking to track metrics and gain insights through visually appealing representations. In this blog, we'll explore the fundamental components of dashboards and walk through a step-by-step guide on creating an informative panel using a popular dashboard creation tool.
Understanding Dashboards: Dashboards are dynamic data visualization tools that offer a consolidated view of key metrics, enabling users to monitor and analyze data efficiently. These dashboards are composed of panels, each functioning as a storytelling element that contributes to the overall narrative.
Components of a Panel:
Query: The query defines the data to be displayed in the panel. It serves as the foundation for the visualization, specifying the metrics and parameters you want to track.
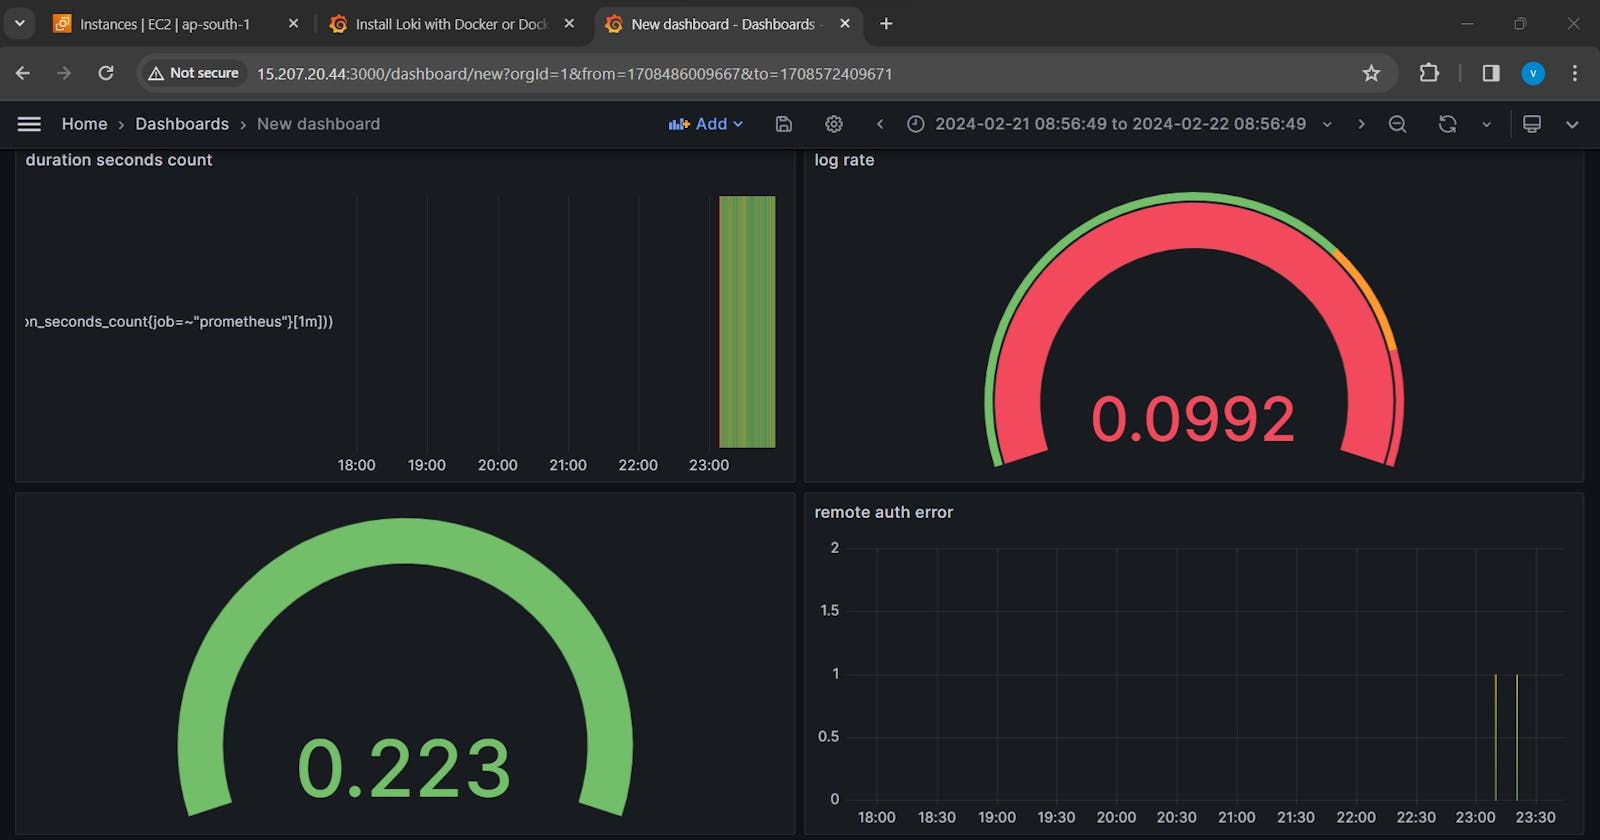
Visualization: The visualization component determines how the queried data is presented. Whether through graphs, charts, or other visual elements, this aspect transforms raw data into meaningful insights.
Step-by-Step Guide to Creating a Panel:
Task 01: Initiating the Dashboard
Access the Dashboard Creation Interface: Hover your cursor over the Create (plus sign) icon in the sidebar and select Dashboard.
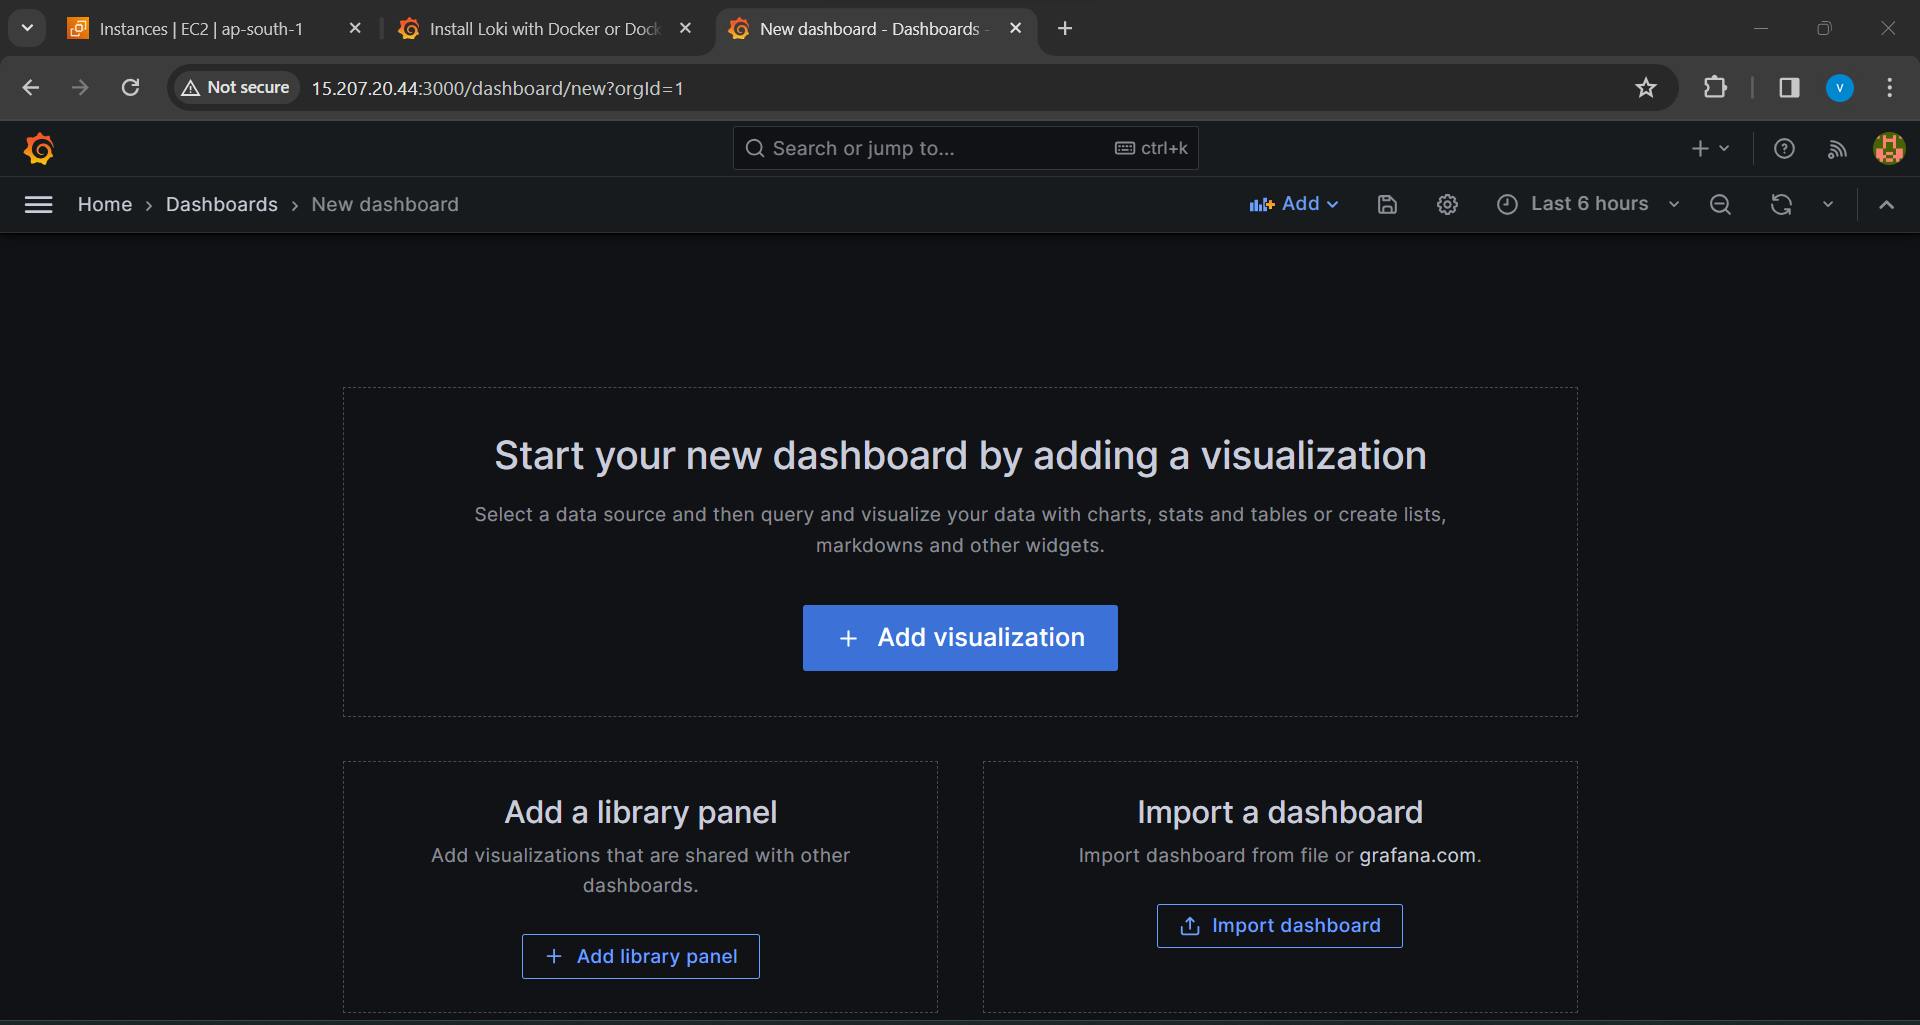
Adding a New Panel: Click on Add a new panel to start building your visualization.
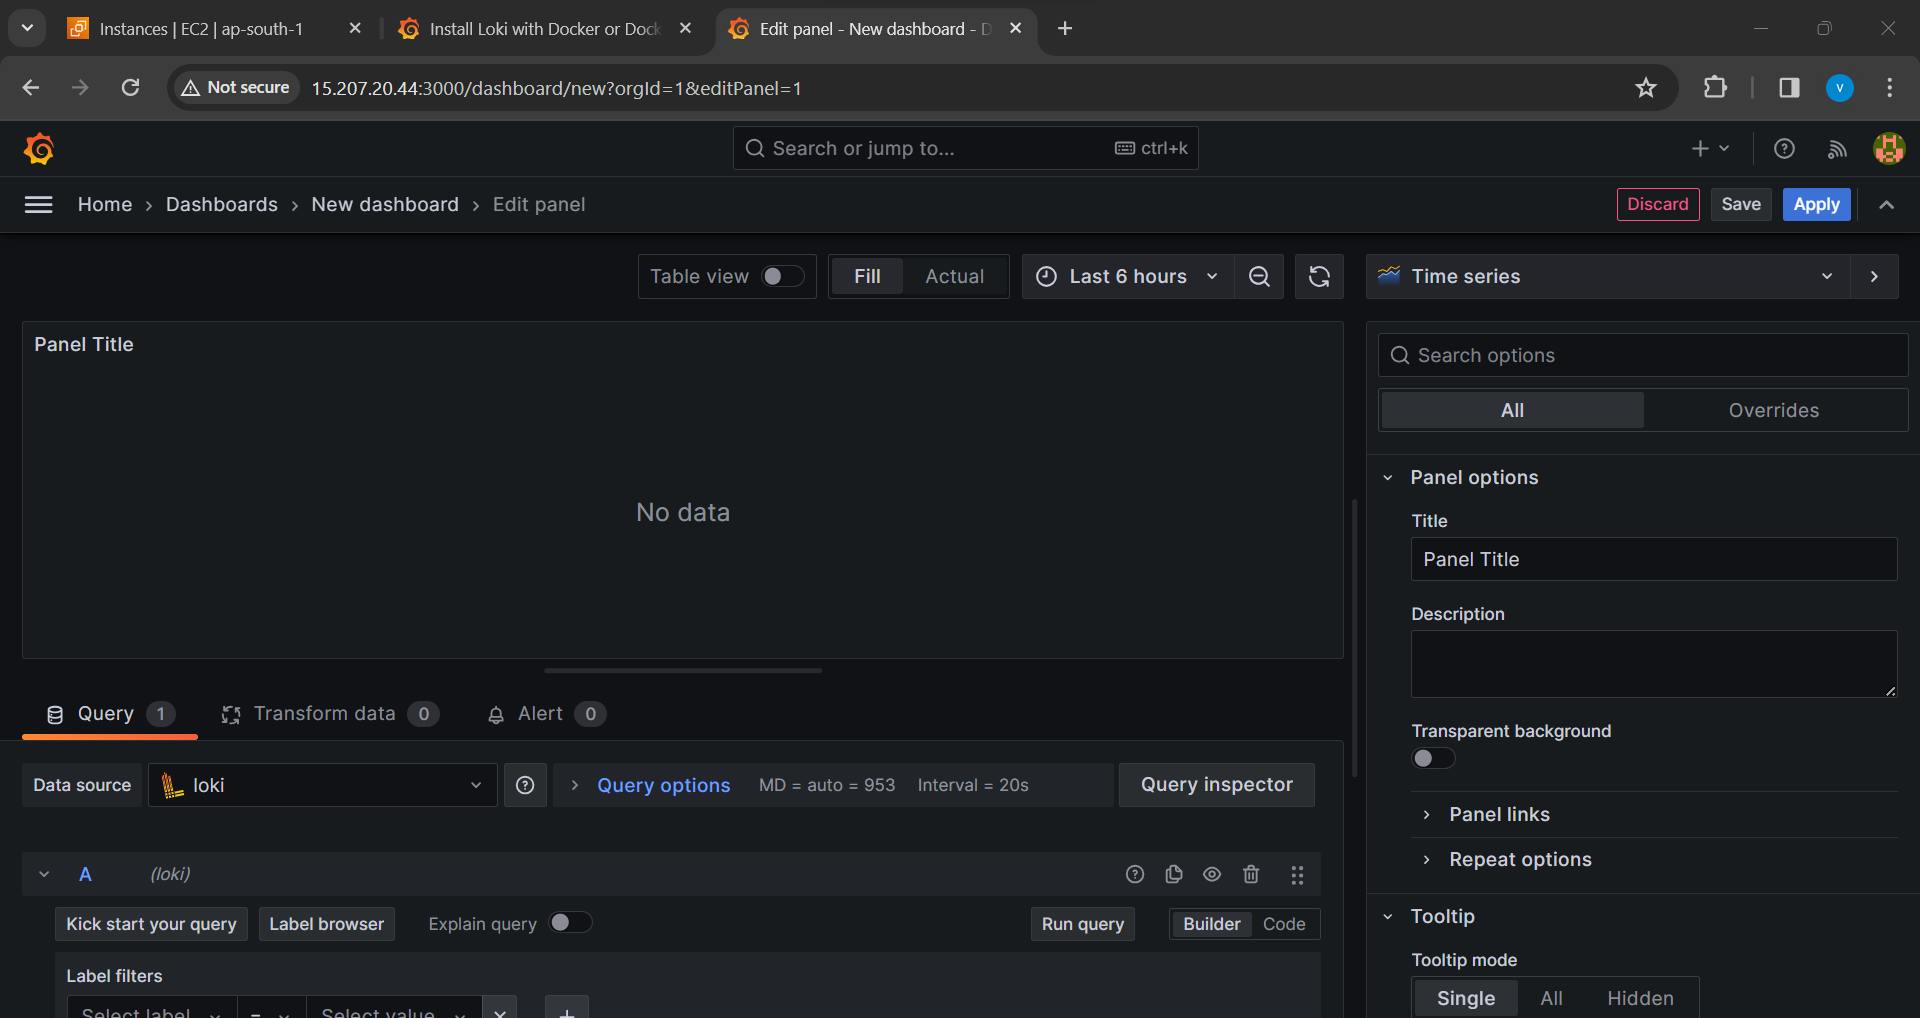
Entering the Query: Within the Query editor, input the following query and press Shift + Enter:
sum by(route) (rate(go_gc_duration_seconds_count{job=~"prometheus"}[5m]))
Customizing the Panel:
Legend Modification: In the Legend field, enhance the panel's readability by renaming the time series with {{route}}. Click outside the field to update the graph legend.
Panel Title Adjustment: Navigate to the Panel editor on the right, under Settings. Change the panel title to "Traffic."
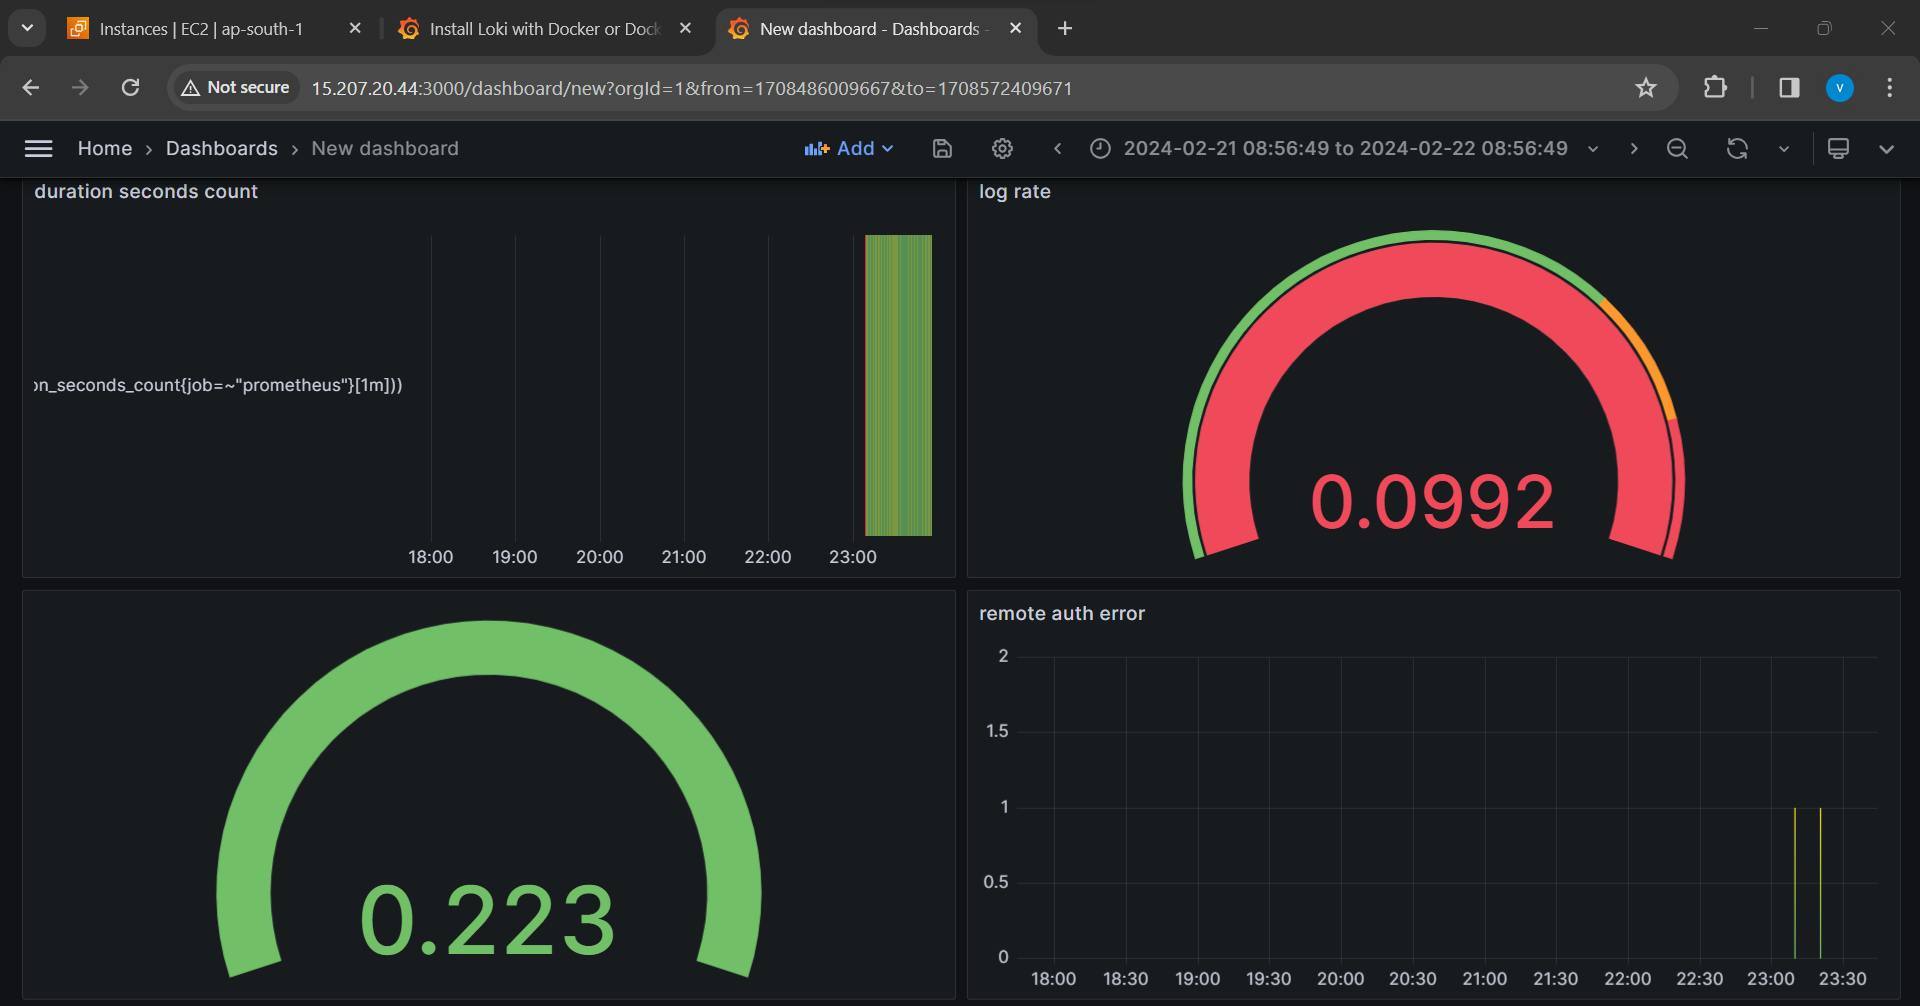
Applying Changes: Click Apply in the top-right corner to save the modifications and return to the dashboard view.
Saving the Dashboard:
Saving the Panel: At the top of the dashboard, click the Save dashboard (disk) icon.
Naming the Dashboard: Enter a name in the Dashboard name field to identify your dashboard and click Save.

Conclusion: Creating a dashboard panel involves a seamless interplay between queries and visualizations. This step-by-step guide illustrates how to craft a meaningful panel for tracking traffic metrics. By mastering these techniques, users can harness the power of dashboards to transform raw data into actionable insights, paving the way for informed decision-making. Whether you're a data analyst, business professional, or tech enthusiast, the ability to construct informative panels is a valuable skill in the data-driven landscape.